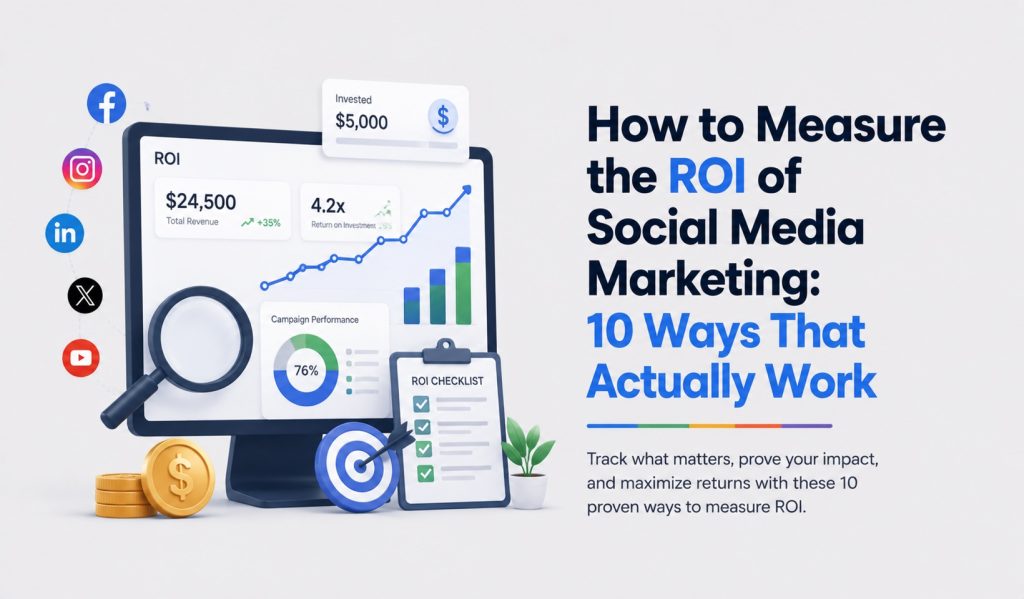
Most businesses have no idea whether their social media is actually making them money.
They look at follower counts, feel good when a post gets a lot of likes, and assume something is working. Then someone asks “what’s the return on all this time and spend?” and nobody has a real answer.
That’s not a content problem. It’s a measurement problem.
Measuring the ROI of social media marketing isn’t as complicated as most people make it out to be, but it does require knowing what to track and why. Likes and reach tell you almost nothing about whether social media is contributing to your revenue. The metrics that actually matter are further down the funnel, and most businesses never look at them.
Here are 10 concrete ways to measure the ROI of Social Media Marketing
1. Set a Goal Before You Measure Anything
ROI without a goal is just a number with no context.
Before you open any analytics dashboard, write down what you’re trying to get from social media. More website traffic? More leads? More online sales? More appointment bookings? Lower customer acquisition cost?
Each of these has a different measurement approach. A brand trying to drive e-commerce sales measures differently from a local service business trying to generate phone calls. If you skip this step, you’ll end up tracking whatever your platform shows you by default, which is usually reach and impressions, and those tell you almost nothing about business outcomes.
Set one primary goal. Then build your measurement around it.
2. Track Website Traffic From Social Media
Google Analytics (or GA4) tells you exactly how much traffic is coming from each social platform and what those visitors do when they arrive.
Go to Acquisition, then Traffic Sources, then Social. You’ll see which platforms are sending visitors, how many pages they view, how long they stay, and whether they complete any goals like form submissions or purchases.
This is one of the most direct ways to connect social media activity to business outcomes. If Instagram sends 400 visitors a month and Facebook sends 80, and Instagram visitors convert at twice the rate, that tells you something real about where to focus your effort and budget.
Most businesses set up Google Analytics and never look at the traffic source breakdown. That’s where the useful information lives.
3. Measure Lead Generation From Social
If your business generates leads (inquiries, form fills, consultation requests, demo signups), you need to know how many of those leads came from social media.
The cleanest way to do this is UTM parameters. A UTM is a tag you add to the end of a link that tells Google Analytics where that click came from. When someone clicks a link in your Instagram bio, a Facebook post, or a LinkedIn article, the UTM tells you exactly which platform and which piece of content sent them.
Without UTMs, all of that traffic shows up as “direct” in your analytics and you lose the attribution entirely. With UTMs, you can see that a specific LinkedIn post generated 14 form submissions last month. That’s a number you can put in a report.
4. Calculate Cost Per Lead From Paid Social
If you’re running paid ads on Facebook, Instagram, LinkedIn, or TikTok, your ad manager shows you cost per result. But most businesses only look at cost per click, which is the wrong metric.
What you want to know is cost per lead, which is the total ad spend divided by the number of actual inquiries or signups that came from the campaign.
A campaign with a $0.40 cost per click but a $120 cost per lead is a bad campaign. A campaign with a $1.20 cost per click but a $18 cost per lead is a good one. The click cost is irrelevant if the leads don’t convert.
Once you know your cost per lead from social, you can compare it to your other acquisition channels and decide where to put more budget.
5. Track Conversions and Revenue Directly
For e-commerce businesses, this is the most straightforward ROI measurement: how much revenue did social media generate?
Shopify, WooCommerce, and most e-commerce platforms have built-in attribution reporting. Google Analytics shows social media as a revenue source when you set up e-commerce tracking. Facebook and Instagram’s conversion pixel tracks purchases that happen after someone clicks an ad.
For service businesses, the conversion you’re tracking might not be a purchase. It might be a booking, a quote request, or a phone call. Set these up as goals in Google Analytics so they’re tracked the same way a purchase would be.
If you sell something and you’re not tracking where those sales came from, you’re flying blind.
6. Monitor Engagement Quality, Not Just Volume
Engagement rate (likes, comments, shares, and saves divided by reach or followers) tells you whether your content is landing with your audience. But not all engagement is equal.
Saves are the most valuable engagement signal on Instagram. When someone saves a post, they found it worth coming back to. That’s intent. Shares mean they wanted someone else to see it. Comments that ask questions or start conversations signal genuine interest.
Likes are the least useful metric in this list. They’re fast, reflexive, and don’t predict purchase behavior.
Track your saves and shares separately from your likes. If your saves are climbing, your content is genuinely useful. If you’re getting lots of likes but no saves and no website clicks, your content is entertaining but not driving action.
7. Measure Share of Voice
Share of voice measures how much of the conversation in your industry or niche your brand owns on social media, compared to competitors.
Tools like Mention, Sprout Social, and Brandwatch track how often your brand is mentioned versus competitors across social platforms. If your brand gets mentioned 200 times a month and your main competitor gets mentioned 800 times, your share of voice is 20%.
This matters as an ROI metric because brand awareness drives purchasing decisions, especially for service businesses where trust is built before a sale ever happens. If your share of voice is growing, more people in your market are talking about you. That’s a leading indicator of revenue growth, even if it takes a few months to show up in sales numbers.
8. Track Customer Acquisition Cost Over Time
Customer acquisition cost (CAC) is the total cost of acquiring one new customer. If you spend $2,000 on social media in a month and it generates 20 new customers, your CAC from social is $100.
Compare that to your other channels. If paid search gives you a $150 CAC and social media gives you a $90 CAC, social is your more efficient acquisition channel.
The question of is social media marketing worth it for businesses almost always comes down to this number. When social media’s CAC is lower than your other channels and the customers it brings in have similar or better lifetime value, the answer is clearly yes.
Track this monthly. CAC from social tends to decrease over time as your organic presence builds, because you’re supplementing paid spend with free organic reach and trust that’s already been established.
9. Measure Return on Ad Spend for Paid Campaigns
Return on ad spend (ROAS) is simple: revenue generated divided by the amount spent on ads.
If you spent $500 on a Facebook campaign and it generated $2,000 in sales, your ROAS is 4x. If it generated $400 in sales, your ROAS is 0.8x, which means you lost money.
Most businesses that run social ads watch their click-through rate and cost per click but never calculate actual ROAS. That’s the only number that tells you whether the campaign made money.
For businesses asking whether social media marketing really increases sales, paid social with proper ROAS tracking gives you the clearest possible answer, because you can see exactly what each dollar of ad spend returned.
A ROAS above 3x is generally considered profitable for most businesses after accounting for product costs and overhead. Below 2x usually means the targeting, creative, or offer needs work.
10. Survey Your New Customers
This one is the most underused measurement tool in the list, and it costs nothing.
Ask new customers how they found you. Not in a complicated survey, just one question at the point of purchase or first contact: “How did you hear about us?”
Social media attribution is never perfect. Some people see your Instagram, think about you for three weeks, search your name on Google, and then book. Google Analytics credits the organic search. The real driver was Instagram.
A simple customer survey fills that gap. If 30% of your new customers say they found you through Instagram over a 3-month period, that’s a real signal that your social presence is driving acquisition even when the analytics don’t show a direct click path.
Track the responses monthly and look for trends. When a particular channel starts showing up more frequently in responses, that’s where your content or ads are gaining traction.
Conclusion
Social media ROI isn’t one number. It’s a picture built from several metrics, each measuring a different part of the customer journey from first seeing your content to actually buying from you.
Start with website traffic and lead tracking. Add cost per lead and ROAS if you’re running paid ads. Layer in engagement quality and customer surveys over time.
The businesses that can’t answer “is social media working?” usually can’t answer it because they never set up the tracking in the first place. Set it up once, check it monthly, and you’ll always know exactly what your social media is doing for your business.
If you want help building a social media strategy that’s actually designed to be measured and optimized, our social media marketing services are built around real results, not vanity metrics.